Recently, a discussion occurred over text among my fellow Illowa APBA League members prompted by Dennis Jennings. The topic? The critical and heavy issue of pitchers’ fielding ratings.
Dennis got things going:
Okay my APBA query (from a Cub fan): how can Jon Lester be rated as a 2 (good fielding) pitcher in last 2 years? Yes Cubs have found ways to cover his inability to make pickoff moves BUT his inability to throw to first and agreement not to field balls – is crazy and not exactly a secret. Any thought what causes them to grade accordingly. Okay yes could hardly be a less important question but still.
My first instinct was to look up Lester’s fielding stats. As Dennis notes, Lester has been rated a P-2 the past two years. While he made three errors in 2015, he hasn’t made any in 2016 or 2017. I know the error stat is not a good indicator of a fielder’s ability but numbers don’t lie. For what it’s worth, Jon Lester’s Master Game MF rating is +1.
However, that is not entirely the reason why Jon Lester was rated a Pitcher-2 in my opinion.
As our commissioner, Mike Bunch opined, the reason Lester received the higher fielding rating was “bump up” the overall defense of their teams.
I’ll take it a step further. I think the extra “bump” is applied to winning teams especially those who went on to the postseason. The Chicago Cubs of 2017 had a total of fifteen pitchers. Only Mike Montgomery, Pedro Strop and Koji Uehara were rated a P-1. All the others (even Jon Lester) were rated as a P-2. Looking across the aisle, the AL Champion Houston Astros look similar. Of their seventeen pitchers, only four were rated P-1.
On the opposite side of the spectrum, the last place Detroit Tigers were evenly split with eight pitchers rated with a 1 and eight rated with the superior grade.
There are exceptions. The Dodgers of 2017 have a few more P-1s then I would expect (seven P-1s out of sixteen pitchers). Just a wild guess here but perhaps the cardmakers look at all the teams when they’re done and decide which ones need a boost.
While this is all valid, Chuck Lucas chimed in. He said not all of this was team-related. Pitchers like Jim Kaat and Mark Buehrle were always rated with a 2. I’ll add Greg Maddux as well.
Thoughts?
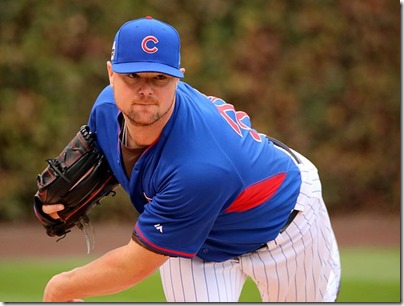
Photo by Arturo Pardavila III from Hoboken, NJ, USA – Photo of the Day Project, Oct. 27, 2017: Cubs lefty Jon Lester throws a bullpen session at Wrigley Field., CC BY 2.0, Link


what it is now, I do not know. The cards and ratings were intended to reproduce team strength, and usage, with the 20 cards per team set. I played ’69 and ’57 with those and it did.
I had occasion to discuss things like this with Skeet Carr at last year’s convention. He said it’s a mix – errors, team strength and “reputation”.