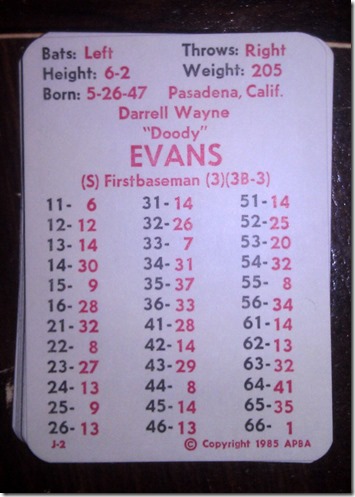
This certainly isn’t the worst APBA card in the world. in fact, for a .232 hitter, 1984 Darrell Evans has a pretty decent on-base percentage. But consider the context…
In 1983 (the year before this card), Evans hit .277 with 30 homers with a nifty .516 slugging percentage. In 1985 (the year after this card), “Howdy Doody” went above and beyond and led the league with 40 homers for the Tigers albeit with a .248 average.
To be fair, despite the .232 average, Evans still maintained a .353 OBP which some of us would love to have.
| Split | G | PA | AB | R | H | 2B | 3B | HR | RBI | SB | CS | BB | SO | |||
|---|---|---|---|---|---|---|---|---|---|---|---|---|---|---|---|---|
| 1984 Totals | 131 | 483 | 401 | 60 | 93 | 11 | 1 | 16 | 63 | 2 | 2 | 77 | 70 | .232 | .353 | .384 |
APBA gave Evans six walks for his 1984 season and that is pretty cool. To be honest, if Evans wasn’t slow, he might make an okay leadoff man if you were desperate. I’m just stuck on his power numbers of 1-6.
Perhaps why I’m so hard on this card is that I’m a closet Evans fan. He’s on my list of “Favorite Players who aren’t considered Superstars”.
Just noticed that Evans never made the All-Star team in 1985 when he led the league with 40 homeruns. He had 18 homeruns in the first half of the season so I’m wondering if his performance in ‘84 had anything to do with it.
That and George Brett and Don Mattingly.


Darrell Evans card is slightly different in the GTOP Volume,
12-25
23-12
26-29
35-14
41-26
42-13
46-29
52-27
53-21
61-37
64-13
So far in the Crazy 48’s….
Evans in 11 games, is batting .355, 2 HR & 9 RBI in 31 at-bats, with 4 BB’s. His OBP is .429 while his slugging is .581 (1.010 OPS). I’m sure this won’t last, he was batting in the .430’s for awhile, so he’s already coming back to earth.