Good news! Frequent contributor Rod Caborn is now back and continuing his populaer Replay Insider series. Here is his newest contribution.
I have never totally recorded detailed fielding statistics for a replay. The number of putouts and assists and the work required to compile stats like assists and putouts is overwhelming and would turn a replay into tedium, not enjoyment.
There are, however, selected fielding stats that are easy to record and summarize as your replay progresses. These include errors, passed balls, outfielder assists and triple plays.
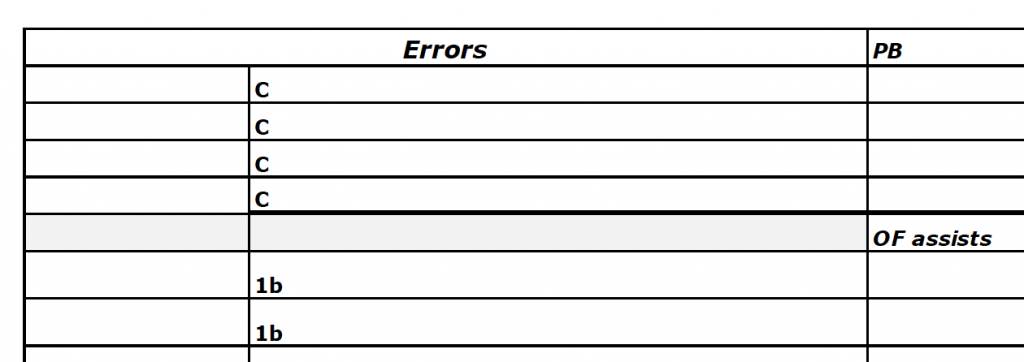
To record these four categories, however, requires some organization, which led me to create a chart to track selected fielding stats. I call it an Errors Chart for the simple reason that it mostly tracks errors.
Here’s what an Errors Chart looks during a replay season.
It recaps the error totals for each player who sees action with a team, by position. If a player is used at more than one position, those positions are shown alongside the player’s name.
For catchers, passed balls are also recorded. For outfielders, outfield assists are recorded.
The chart can also be configured to record stolen bases surrendered by catchers and stolen base throw outs by catchers. Also, I have recorded the number of GIDPs that teams have recorded. I have kept up with these in some of my replays but have given up the catcher’s SB stats and fielding GIDP stats for the simple reason that I record much other information that I simply get lost in some of the stat-keeping.
Another variation is to add fielding notes for fielding events triple plays or a special fielding achievement like an outfielder throwing out more than one runner in a game. When you complete your replay, you always find some unusual events in the fielding notes.
In short, exactly how you use the Errors Chart is up to you, but keeping very basic fielding records can add your enjoyment of a replay without adding too much extra work.
I’m glad Rod is back with Replay Insider! Stay tuned for more!


Hi Rod,
Always interesting to hear about how others handle this. Personally, I don’t track individual errors but can usually know which person is having a particularly bad season defensively.
What I do track is team errors, double plays and triple plays. I have done enough replays now to know that it’s fairly true to how the team is set up, although in my current replay it is not matching up properly for one team, but I know exactly which player is causing the discrepancy, so even that helps me when I do my recap of a replay.