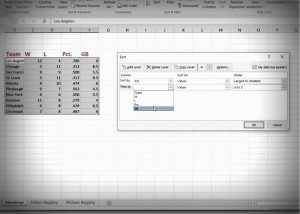
Hey APBA replayers who use Excel, I have another Replay Stats with Excel video up on YouTube. As always this is using my 1966 NL replay.
[be best if you watch in full screen mode to see all the Excel goodness]
This episode deals with creating a league standings table. As with most everything in my Excel setup, it is pretty much self-sustaining once you create it. The biggest concept used is linking cells as you are simply pasting links from each team’s total pitching wins and pitching losses.
It isn’t too difficult to create and once you do, you can format to your heart’s delight to make it look nice. The trickiest part for me was the Games Back formula. I have found one that has worked pretty well. Here it is broken down…
Assuming the first place team is on row 4 and the Wins column is C and the Losses column is D, this formula should be entered for the first place team:
=(($C$4-C4)+(D4-$D$4))/2
Since the first wins cell and the last losses are absolute references, you should be able to copy and paste that formula (or simply click and drag it down as in the video) and the relative cells references will change and the absolute ones will not.
Files used in this video
Here are the Excel files I was using during the video. They are compressed in .zip format.
Mentioned in this video
This Week in APBA by John Asalon
Coming up next: Pivot tables! Also coming up: Game schedules and results.
If you want to watch past replay Excel tutorial videos in this series, here is the link. I hope this helps!


