 I have never totally recorded detailed fielding statistics for a replay. The number of putouts and assists and the work required to compile these (at least for me) is overwhelming and would make a replay seem like work, not play.
There are, however, selected fielding stats that are easy to record and summarize as your replay progresses. These include errors, passed balls, outfielder assists and triple plays.
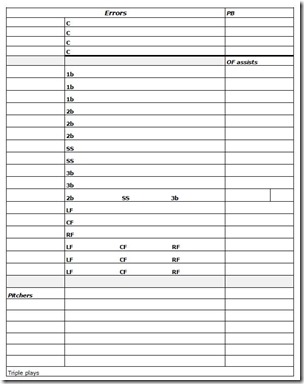
To record these four categories, however, requires some organization, which led me to create a chart to track selected fielding stats. I call it an Errors Chart for the simple reason that it mostly tracks errors. because selected fielding stats. Here’s what a completed Errors Chart looks like at the end of a replay season.
The chart has a lot of flexibility. It can be configured to record errors, errors by position, passed balls, OF assists and anything else that might be interesting to you.
How you use an Errors Chart is up to you. I like to keep a lot of fielding information, so I record all of these categories, as well as anything else that catches my attention as a replay progresses.
If you’re not inclined to record anything other than individual errors without any detail, that is your choice. You can make it as easy or complicated as you wish.
Next: Using the Errors Chart


