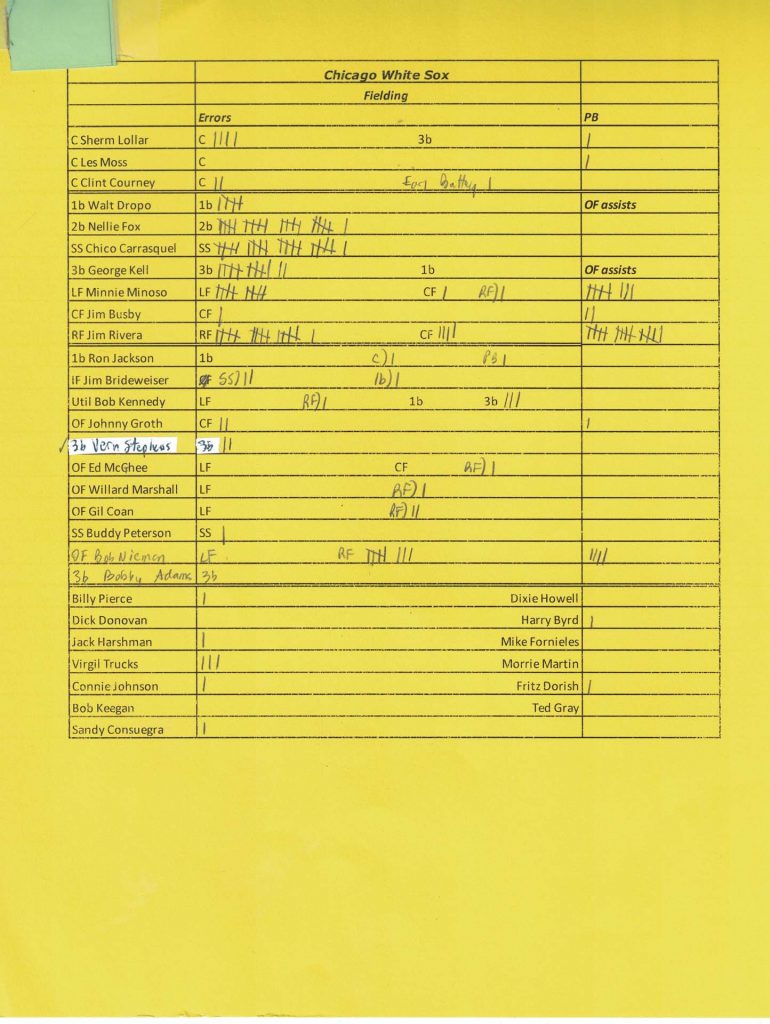
Tracking errors on the Errors Chart is simple.
After you tally up your batting stats, simply record errors, by the name of the individual on the Errors Chart. It only takes about 10 seconds and the information adds another dimension to your replay.
You can simply record total errors or, if you want to track more detailed data, you can track individual errors at each position they played. If you want to add some spice to the Errors Chart, you can also record catcher’s passed balls and outfielder assists.
Finally, you can record unusual fielding accomplishments by writing the information at the bottom of the sheet. Triple plays, two OF assists by a single player in a game, an unassisted double play all would qualify as unusual fielding accomplishments. Noting unusual fielding events adds depth to your replay and underscores the importance of defense for each team and individual player.
Attached is an illustration of what a completed Errors Chart looks like. It recaps the fielding totals at season’s end for the 1955 Chicago White Sox, part of a 1955 American League replay.
The Errors Chart shows, at a glance, that the White Sox had a pretty decent defense. 2b Nellie Fox had 21 errors, the same as SS Chico Carrasquel, both pretty modest error numbers for the two key middle infielders at the end of July. RF The defensive skills of C Sherm Lollar are impressive, with only four errors and a lone passed ball.
Jim Rivera had 15 OF assists, one of the better totals in the replay, where Rivera spent most of his time in right field. Generally speaking, right fielders have thrown out the most baserunners in every replay I have ever conducted.
What the chart does not show is how many runners took advantage of outfielders with sub-par arms, an interesting stat that has not even yet appeared in today’s flurry of new (and generally useless) new stats. Also not measurable is the number of times that managers decided not to run on an outfielder with a strong game.
Also missing from the chart is the number of stolen bases allowed by a catcher and the number of baserunners caught stealing by a catcher. These are two stats, however, that could easily be incorporated into the Errors Chart.
Next: A shortcut to identifying catcher’s wild throws


Fox and Carrasquel with 21 errors each by the end of July?
No disrespect, but in what baseball universe is a combined 40+ errors in roughly half a season considered a “modest” error total?
Thanks.
Gary Growe
APBA since 1965
What is really amazing is that in real life, Carrasquel made 18 errors and Fox 24 errors in the entire 1955 season.
What that means is that there were a lot of 18 and 20 error results. APBA fielding realism on error counts is shaky, but it is what it is.