


 Scott Fennessy just sent me this fantastic recap of his 1901 replay. I’m actually splitting it up into two posts. I’ll post his write-up on his World Series replay in a couple days.
Anyone interested in doing a deadball replay should seriously read this write-up by Scott. Not only does he give a detailed team-by-team analysis but he discusses his methods, intentions, highlights and yes, some of his frustrations with the teams and players. Thanks, Scott!
-Tom
First off I wanted to thank Tom for inviting me to post this article on my first ever full season replay. I am still in the process of converting all my hand computed stats, and while I have all the totals, I don’t have anything set up on spreadsheets for review, but if anyone wants info on a specific player just let me know and I will provide what info I have. Because I am doing all the stats by hand I did not keep stats on a level such as Baseball reference.com, but I covered the main. (I noticed far too late about runs scored so I decided not to start after 2 months of stats had been recorded and the score sheets were shredded)
So first a bit of a breakdown on what motivated a guy like me who had for a good portion of my APBA days preferred the power hitters to play a dead ball era season? I always have been fascinated by the players of the early days and had actually suggested that APBA create a set from the 1876 inaugural season for the National League, but after going to baseball reference’s site I see why they have not. I have since purchased the baseball for windows and have created every team and in process of playing this electronically. But I digress, I am a Chicago Cubs fan first, and a baseball fan second, and wanted to travel back in time as far as APBA could take me so 1901 was it.
Regarding the teams in general, defense is almost nonexistent. There are some fine individual defenders, but most of the teams are fielding 3 and in some cases would be fielding 4 if the charts went that low, with the Braves being the only fielding 1 team I could put together. Nearly every player has error numbers at 53 and 21, and I had 5 teams commit 200 or more errors as a team, with 2 more committing 190 or more in just 140 games. There is an unusual number of players with 23 on their cards, so third basemen were dropping like flies. Charlie Dexter of the Cubs, Tom Leach of the Pirates, and Fred Hartman of the White Sox visited the DL 7 times each.
Pitching and speed were king. That said there were in fact some power hitters in the game. I had never bothered to use the games restricted as I usually played under the theory “what if this player played a full season instead of being a September call up?” Fortunately I have never had a player with a monster card that would have altered history drastically so it has never been an issue before. That said I had considered using a games restriction but after seeing how small some of the rosters were (the White Sox have 10 position players the Indians 11) I decided to just play the best 9 I could, and nobody seemed to put up super human numbers. Regarding the post season awards; the AL MVP was a no brainer and I made the selection myself, but I emailed several friends regarding the other awards as it was too close to call on my own.
So here is a brief description of each team. I played the entire 140 game schedule provided by the fine folks at APBA and went with a 3 man rotation for every team. Starting with the American League review:
| Final Standings 1901 | ||||
| American League | ||||
| White Sox | 107 | 33 | ||
| A’s | 84 | 56 | ||
| Red Sox | 79 | 61 | ||
| Orioles | 71 | 69 | ||
| Tigers | 70 | 70 | ||
| Senators | 49 | 91 | ||
| Brewers | 48 | 92 | ||
| Indians | 44 | 96 | ||
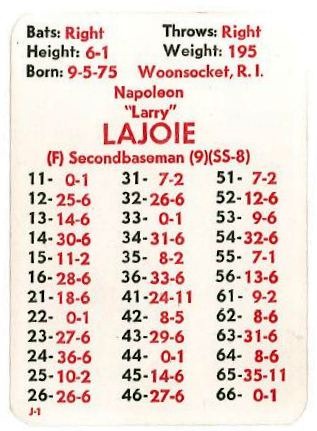
| AL MVP | Napoleon Lajoie | |||
| Philadelphia A’s | ||||
| .422 AVG | 16 HR | 147 RBI | 55 SB | |
| AL Cy Young | Cy Young | |||
| Boston Red Sox | ||||
| 33-11 | 2.36 ERA | 157 K | ||
Chicago White Sox
The best overall pitching staff in the AL, featuring 2 A starters James Callahan (35-10 1.99 ERA .71 WHIP) who also rated at second, 3rd and OF and VERY deserving of a monster Monday card, was the opening day starter and #2 man and future Twins owner Calvin Griffith (32-12 3.10 ERA) as well. 2 B starters Jack Katoll out performed his B (Z) card finishing with a 32-9 record. Manager Fielder Jones (.316 AVG 2 HR 70 RBI and 60 SB) paced the team that cruised to the AL Title. Roy Patterson racked up 21 saves, despite not seeing a lot of action.
Philadelphia A’s
The team I expected to give the Sox their biggest threat, and they actually were in front at the half way point, but then the injuries piled up and they faded badly. That said I think I enjoyed playing this team more than any around, and not just for league MVP and last week’s monster Monday card Napoleon Lajoie (.422 AVG 15 HR 147 RBI 55 SB .463 OBP) Lafayette Cross (.315 39 SB) was having a great year before he went down. Jasper Davis (.288 AVG 11 HR 106 RBI) Outfielder Matt McIntyre went down next which allowed for an interesting development as pitcher Bill Milligan D(Z) starter who was rotting in the bullpen and not exactly shutting anyone down was rated as an OF 1 and had a 1-2-2-1 so I put him in and about 50 games as the replacement finished with a .245 AVG and 15 HR. “Socks” Seybold would have hit the 100 RBI mark but missed the final 3 games with an injury. Final numbers were (.304 AVG 5 HR 99 RBI) and while a fine season underperformed his 0-1 0-1 0-1 0-1 card fairly badly for power numbers. Eddie Plank ( 30-11 2.80 ERA) paced the staff.
Boston Red Sox
A team that I was pretty disappointed with. Cy Young, the highest rated pitcher in the game A&C (Z) won the award that would be named after him with an outstanding season (33-11 2.36 ERA 167 K) Jimmy Collins the first time I have ever seen a 3B6 defensive rating 01 01 01 01 with an 11 as well (.305 AVG 7 HR 51 RBI 46 SB) Buck Freeman paced the offense with a fine season (.334 AVG 12 HR 92 RBI)
Baltimore Orioles
John McGraw was the catalyst for this team hitting an even .300, but now the real numbers to watch, in 130 games he drew 115 walks while striking out only 3 times leading to his .436 OBP. He lead the majors with 96 steals. ”Turkey Mike” Donlin stunned me with his numbers on a card that did not have all that much power 4 0-1’s but these were the only 1’s on the card and he finished with a fine (.348 AVG 14 HR 86 RBI 37 SB). Roger Bresnahan was the luckiest player in the game this season, despite having an 02-02-01 he hit 5 homers. John McGinninty won 30 games but still got hit to the tune of a 3.90 ERA 1.22 WHIP.
Detroit Tigers
Another team that I expected a little better numbers from. They usually beat the lower division teams, they also got roughed up by the top 3 teams, but the one consistent thing they did, and did well was run. 4 players had 45 or more steals and two cleared 50. Lewis McAllister was the teams best player his .325 AVG 6 HR 63 RBI and 53 SB led the way, Ducky Holmes did drive in 93 and stole 52, but was a major disappointment for a 4 0-1 card finishing with 6 HR and a .257 AVG. Ed Seiver went 23-18 with a 2.83 ERA, but there was little help from the rest of the staff.
Washington Senators
A pretty awful team, save San Dungan (.331 AVG 3 HR 72 RBI). Despite having 3 C starters nobody pitched well at all and the team ERA was near 5.00.
Milwaukee Brewers
Other than John Anderson (.299 AVG 10 HR 81 RBI) there was not a lot to root for on this team. Although I did try an experiment with Brewers outfielder David Jones (perhaps Adam Dunn in his first lifetime?) (.199 AVG 28 HR 64 RBI and 94 walks in 122 games was a J-4 that I played simply as no other outfielders were doing anything so I started playing him more often. While the stats he put up were not eye popping by today’s standards was not realistic for the day. (I had some real luck hitting 1’s on some players). Perhaps the ultimate “All or nothing” card I have ever seen; his card has the standard out numbers and nothing outrageous, but his only hit options are a home run or a single. The card is a 1-8-8-1 with an 11 and a 14*.
Cleveland Indians
This was a team I expected nothing from, and I was not disappointed. Just 2 years removed from the disastrous season of 1899 in which they put up the worst season in history, they fared little better in 1901. They did have 1 B and 1 C starter, they had almost nothing else at all. Ervin Harvey led the team (.312 AVG 1 HR 81 RBI) but other than Bill Bradley’s 12 homers while spending a good portion of the time on the DL. He only had 3 1’s so I was really surprised. Oliver Pickering stole 49 bases.
And for the National League…
| Final Standings 1901 | ||||
| National League | ||||
| Pirates | 100 | 40 | ||
| Phillies | 97 | 43 | ||
| Braves | 85 | 55 | ||
| Dodgers | 80 | 60 | ||
| Cardinals | 62 | 78 | ||
| Cubs | 54 | 86 | ||
| Giants | 42 | 98 | ||
| Reds | 38 | 102 | ||
| NL MVP | Ed Delahanty Philadelphia Phillies | |||
| .392 AVG | 12 HR | 112 RBI | 48 SB | |
| NL Cy Young | Vic Willis | |||
| Brooklyn Dodgers | ||||
| 33-11 | 1.66 ERA | 96 K | 11 Shutouts | |
| 2 No Hitters | ||||
Pittsburgh Pirates
Arguably the best overall team in the game. 3 A starters 1 B and 2 C starters as well. While nobody had a lot of power, every card was a threat. The only reason they did not run away with the league title was injuries to a couple of players, notably Tom Leach. Clarence Beaumont (.333 AVG 7 HR 78 RBI 50 SB) was even better than I expected and was the player who led the charge down the stretch when Fred Clarke (.330 AVG 4 HR 98 RBI) and “Honus” Wagner (.310 AVG 7 HR 87 RBI) stumbled at the end. Jesse Tannehill almost won the Cy Young award with an impressive 32-9 W-L 1.41 ERA 0.71 WHIP and took 5 no hitters into the 8th (every one broken up at 7.2 innings, which seems to be the magic number for me overall).
Philadelphia Phillies
An awesome team that was in the race until the final series of the season. This team could rake. Roy Thomas set the table at the top of the order with 105 walks and just 14 strikeouts. Although he stole 54 bases his .293 average was proof he didn’t steal first base too. MVP Ed Delahanty hit .392 with 12 home runs while driving in 112. He also stole 48 bases and was at the heart of almost every rally. Elmer Flick was one of the players that challenged for the MVP title also hitting .359 with 6 homers and 136 RBI and 51 steals. The team motto must have been “crowd the plate” as Hughie Jennings (.304 AVG 100 RBI 47 SB was beaned 21 times. Thirdbaseman Harry Wolverton also got drilled 21 times 3 of them resulted in trips to the DL. 3 others were hit more than 5 times and they easily led the majors in this category. Al Orth (32-10) and Red Donahue (32-12 159 K with 1 no hitter) were extremely tough to hit, and “Doc” White was no slouch either, winning 29 games as a pitcher and as a hitter deserves a Monster Monday Card hitting .362 with 1 home run ant 19 SB as well.
Boston Braves
A team that vastly performed better than I expected. The only fielding 1 team and the defense saved many games/runs and allowed the pitching staff to control the games. They had to as the offense was a major disappointment. I didn’t expect many stars but nobody on this team performed to their cards except leadoff man Billy Hamilton (no relation to the Reds minor leaguer) hit .286 and stole 47 bases. Only one other hitter cleared .250 and that was Gene DeMontreville at .254. Cy Young Winner Vic Willis was the king of the staff going 33-11 with 2 no hitter (both off the Reds in a 3 week span) and 11 shutouts. How they finished 3rd I have no idea, because looking at the numbers they were a horrible team.
Brooklyn Dodgers
Another good team that was decimated by injuries to key players. Jimmy Sheckard hit .316 with 8 homers and stole 54 bases. Willie Keeler may stand 5’4” but he hits like he is 10 feet tall and bulletproof. Hitting.369 with 44 steals and the master of the hit and run (3-31’s) kept as many innings alive as he could. Bill Dahlen hit.279 with 6 homers and 85 RBI and 42 steals despite missing a quarter of the season and his loss really hurt. Combined with the loss of Duke Farrell missing half the season (he still finished with a .291 average and 81 RBI. Bill Donovan was among the better pitchers in the league (29-13 179 Ks 1 no hitter 1.67 ERA 0.79 WHIP) Jim Hughes was the biggest disappointment of the season. A grade B starter he went 18-20 and had an ERA over 8. I tried starting Doc Newton a C starter to limit the damage but he was not enough to stop the slide going 8-7 with an ERA over 4.
St. Louis Cardinals
As a Cub fan it is hard for me to do anything involving the Cardinals, but they had a pretty decent team they just did not have the horses to run with the top 2 teams. Jack Powell no hit the Cubs and became the only B starter to do this. I was so unhappy the dice took a trip across the living room. But that was the only highlight for the pitching. However things were much brighter offensively. They held the distinction of being the only team to field the same lineup all 140 games. Emmett Heidrick hit .339 8 HR and stole 44 bases, Jesse Burkett who was the most clutch hitter on the team hit .343 and stole 50 bases and drove in 86. Bobby Wallace seemed to thrive with Burkett in front and they became a devastating hit and run combo. Most of his .290 average seemed to come on 2 out hit and run situations.
Chicago Cubs
My beloved team. Unfortunately they don’t love me as much as I do them. I knew from the start they would not be much of anything, but with 3 B starters and perhaps the fastest team in the league I had hoped for a little more. Of the famous Evers-Tinker-Chance combo only Frank Chance was on the roster at this point and while he didn’t do a LOT offensively, he did lead the NL in steals with 92. Tullos “Topsy” Hartsel came out of nowhere to be the brightest spot offensively (.310 AVG 6 HR 46 SB). Shortstop Danny Green was one of only 4 players to hit grand slams this season finishing with a .262 AVG 9 HR 93 RBI and 43 SB. Rube Waddell deserved better numbers than he finished with at 22-18 but as a hitter was even better hitting 2 come from behind game winning homers and his final batting numbers included a .290 AVG 9 triples 5 HR and was actually a bigger threat than most of the regulars.
New York Giants
Only Christy Mathewson saved this team from the cellar. An A starter also rated as a 3B3. Final numbers (19-26 W-L 2.33 ERA) on a very forgettable staff. Only George Van Haltren had anything to smile about finishing with a 14 game hitting streak and a .311 AVG. George Davis hit 12 homers but only .268 for the season. 1 starter hit .208 and two more hit UNDER .200 and the reserves even worse.
Cincinnati Reds
And then came the Reds. This may well be the worst team APBA has ever produced. They were no hit 4 times during the season and Rube Waddell and Jesse Tannehill took no hitters into the 8th on them. “Noodles” Hahn was a great pitcher on a horrible team, yet he still won 19 games and had a 3.19 ERA. 6 of the 9 regulars hit under .250 and 3 under 200. None of the reserves cleared 200 and 2 less than 100. Only “Wahoo” Sam Crawford deserves mention his 0-2 0-2 0-2 1-2 card was impressive and his final numbers were .315 AVG and 21 homers. If he had had anything resembling base runners in front of him he would have cleared 100 RBI easily, but since everyone else stunk he was saddled with many bases empty situations and wound up with 76 RBI and second in the MVP balloting.
Thanks again to Scott Fennessy for sharing his work! Great stuff! Keep an eye out for his 1901 World Series replay recap in a couple days.
“AL Cy Young Cy Young”
that made me giggle. :)
great job. I’ve always felt that to be an APBA replayer (or league member), we have to be a manager, a GM, and a sports journalist all rolled into one. Being able to tell the story of a replay and keep it interesting isn’t always easy. Nice work!
This is a FANTASTIC writeup.
Hi Beignet,
Thank you for the reply. This is my first ever blog as well as a full replay. I was worried I would be too long winded but I wanted people to know just how much fun I had and enjoyed the games.
And that Lajoie card is almost spellbinding …
Got a 1901 replay going myself, so this was interesting to me. Using a few mods, like home-brewed ratings on the pitcher cards. My formulas tend to result in pitchers getting slightly better grades than appear on the cards, also introduces the new K, R and ZZ ratings on a few guys as well.
Examples: Tom Hughes (225 K, 308 IP) has a K. Charlie Hickman (11 K in 65 IP) has an R.
Still early going, but maybe I can submit an update to the blog here at some point. So far the homebrewed formulas seem to be doing well for me.
I kind of like that you just tried to do the best lineups possible. So far I’ve been going with APBA’s suggested lineups and rotations. But before the game I roll the dice for any player in the lineup who has a J rating. J1 has to rest on a roll of 11, J2 on a roll of 11-13, J3 on an 11-16, and J4 on an 11-26. Just seems injuries don’t come up often enough, but maybe I’m just not giving the game enough of a chance.
Hi Chris,
I have never really played with modifications that much and was curious as to how your formulas work and how you do them.
I am going to do the 1905 season next and am always open to suggestions.
Scott,
I won’t speak for Chris’s, but I re-grade for pretty much all ABPA sets, especially any calculated before the mid-90s or so, when I believe the company was using absolute ERA cutoffs for grades instead of indexing for overall league quality.
On mine I do a mixture of 2 parts H/9 (squared) and ERA, with both indexed to the league averages. Hughes, to use the example above, had a 3.24 ERA in a 3.49 league and a 9.0 H/9 in a 9.7 league. That comes out to a Grade B(K). Hickman would be a D(R)(W). Cy Young would be A&C(Y)(ZZ). Bill Donovan would be a B(X)(W)
Keep in mind that altering grades *could* lead to an increase in offense. My belief, and I’m willing to be convinced otherwise, is that Dead Ball cards calculated before around 1995 will have a huge number of over-graded pitchers, since even the dregs sometimes have nominal ERAs which in normal years would warrant a B. If the pitchers were over-graded, then the cardmaker might have made an adjustment to the hitting cards (say an extra PRN-7) that against downgraded pitchers could lead to an unstoppable flood of first-and-third singles.
This stuff is all seriously intertwined. I think re-grades make sense, but if you’re doing a “serious” replay with the intent of seeing how close you come to real-life batting and pitching levels, you have to be careful that fixing one thing doesn’t break five others. That Lajoie card has 3 8s. You wouldn’t want to see him hit .475 because you downgraded half the Bs into Cs.
Pardon my long-windedness. I find grading and card-making fascinating topics, but the more you learn, the more you realize how delicately balanced our game is.
Hello everyone!
Great topic! I am wrestling with this very issue with my 1949 original issue season set. There are lots of walks in that set, and most who have used it say there are way too many, particularly in American League. So, I am all ears when it comes to recalculating walks and even strikouts. I am not experienced enough in regrading to do much on my own but have used some formulas from others to help me along. I also agree that there is a balance with which we dont adjust too much and ruin other facets of the game in the process of the regrading and/or recalculating. I have been playing APBA since 1981 and I have yet to recalculate or regrade anything. SO this is all new to me and also fascinating.
Thanks guys!
I don’t want to take away too much focus from Scott’s terrific writeup here. Congratulations to him for completing a two-leagues replay, and kudos to the interesting and entertaining way he wrote about it. I’m looking forward to the World Series entries.
’49, though, is a classic example of what I’m talking about. Take Earl Johnson. He walked 4.9 batters per 9 innings, but the AL averaged 4.6. So despite having a walk rate (either by inning or batter faced, same difference in this case), only a tick worse than average, the poor bastard gets saddled with the W. Put that W in a set with all those 14s and now you have a ton of runners on first, so all of your 1-5-5 guys get to be triple-1 guys more often. And the chain reaction sets in. It makes sense to upgrade Johnson from W to none. He’s a league-average pitcher in terms of walks, but 1949O turns him into a Roman candle.
Beignet – I have actually found the exact *opposite* of that. I don’t have the exact number in front of me, but I would say that when I ran stats through the formulas it probably ended up improving a pitcher’s grade something like 30%, left them alone 60%, and downgraded them 10%. Like I said, that’s just memory. I’d have to really sit down and look at it…
For comparison to the players you mentioned, the formulas I used ended up with the following:
Hughes
You -> B(K)
Me -> B(K)(W)
APBA -> B(Y)(Z)
Found it curious that APBA gave him a Z despite his BB rate being 42% higher than the league average.
Hickman
You -> D(R)(W)
Me -> D(R)(W)
APBA -> D
Cy Young
You -> A&C(Y)(ZZ)
Me -> A&B(XY)(Z)
APBA -> A&C(Z)
Bill Donovan
You -> B(X)(W)
Me -> A(XY)(W)
Me -> A(Y)
Interesting to see some of the differences. Honestly, my ratings are based on formulas that somebody else presented to me elsewhere on these forums, so I need to give credit to them for it. The pitcher grades are kind of my own concoction, trying to break down the numbers.
I have NO IDEA if they’ll work out more accurate or whatever. Like I said, I’m only maybe 10 games into my replay so far.
To be honest, though… looking over some of Tom’s final stats, I’m thinking that re-grading *might* be a mistake. His numbers look reasonably close, aside from the mention of the Washington team ERA being about a full point higher than expected.
I might have to scratch my project and start over! :-) I think I honestly wanted to be able to incorporate the new R and K ratings and my formulas definitely came up with a few pitchers who would’ve warranted those in 1901.
Hi Chris,
This is something for me to think about as other than a minor tweak or two on the fielding charts have been too afraid to fix anything.
That said I went back last night and went through the numbers for Hughes and compared his numbers to the other B starters in the league and it really turns out that he was just a pitcher who had a flukey bad season.
The biggest thing for him was he just gave up a lot of singles to players on 7’s or 9’s. All the other B’s seem to be within tolerances.
Considering I didn’t complain when Bresnahan hit 5 homers on a card with only 3 0’s and one 1 I should not gripe when things go badly for someone.
I am planning on ordering the 1905 season tomorrow and hopefully it won’t take 3 years to finish.
This might be beating a dead horse, but I hope some people might find it interesting…
Here’s what I found comparing my grades against the official set.
First off, I only looked at the 50 pitchers who amassed 200 or more IP in 1901.
According to my formulas…
30% of pitchers were under-graded
52% were where they should be
18% were over-graded
So this is pretty far off from what I said above. The biggest extreme for me was Jack Taylor, who I downgrade to a D(Z) from APBA’s B(Z).
Here’s where it gets interesting…
According to my formulas…
62% of pitchers had were over-rated on control
38% of pitchers were correctly rated on control
0% of pitchers were under-rated on control
Wow! So… as much as I think that pitchers are (in general) graded to give up too many hits, that’s probably counter-acted by how many (Z) ratings APBA gave out. Of the 50 pitchers in my sample set, APBA gave a (Z) to 42 of them! I had 17 pitchers with a (Z) and 8 with a (W).
On the strikeout side, the opposite…
66% of pitchers had were under-rated on strikeouts
34% of pitchers were correctly rated on strikeouts
0% of pitchers were over-rated on strikeouts
In fact, APBA gave only 6 (Y) grades to the 50 pitchers in this sample. I gave out 6 (X), 18 (Y), 7 (XY), and 2 (K) ratings.
Anyhow, I found this very interesting. I guess what I’d be most curious to see from somebody who actually finished a season is the league ERA (broken down by AL and NL separately), the league BB/9 and the league K/9.
Like Beignet pointed out, it’s a delicate balance. Maybe by being too liberal with my strikeout ratings, it takes away a few double plays and inflates the league ERA. Ditto with me generally downgrading walk ratings. On the other hand, I’m generally bumping up pitcher grades.
Total difference just might end up being COMPLETELY NEGLIGIBLE.
Well I feel like I’ve wasted a lot of time! :-)
Chris, love the data. Almost shocking how many Zs APBA gave out … I’d love to know when that set was calculated. Per my copy of the 12 List, it looks like it was published in 1984, so I’m pretty sure that they were using absolute instead of relative cutoffs. Baseball-Reference has the BB/9 for MLB as a whole as 2.5. Given that APBA was long giving pretty much anyone with sub-3s a Z, it stands to reason that a set released before the more-recent recalculations is going to have a truckload of high-control pitchers. Almost exactly the opposite of what we see with 1949.
I’m a very strong believer in rating hitters and fielders “literally” and pitchers by relative performance to the league. I also prefer hit-based grades instead of ERA-based ones. But you know what? Even with the discrepancies between the (presumably) 30-year-old gameco-issued ratings and what you and I think they “should” be, Scott’s replay still turned up impressively close.
Exactly! So what the hell do we know?! :-D
As you said earlier, APBA must have given ratings based on some baseline that was *not* season dependent, hence almost all pitchers receiving Z ratings and only very few Y (and no X ratings). Really would be curious what grades and ratings they would give these pitchers if they ever re-did the set to make it compatible with the latest version of the boards. Might not happen in my lifetime!
Curious, too, what happened with Washington’s pitchers. They issued the fewest walks in the league (do they have lots of Zs?), but surrendered the most hits. What killed them was giving up 51 home runs when the other 7 AL clubs allowed an average of 25. I’m also willing to be that their runners-on/bases-empty splits were pretty poor, too, but if this was a Basic replay, the game engine doesn’t have any way to directly account for all the HRs and the bases-empty splits (though the engine’s methods for indirectly influencing them are surprisingly sophisticated).
Simple game, no?
Beignet,
Washington was assigned 3 C starters, and I since I packed away the cards I am not sure but I think Lee and Patten were C(Z)’s Carrick was a C.
I went back and most of the damage to the TEAM era was from Carrick whose era was 4.87 Gear’s (grade D) era in relief was 6.00. Lee actually had a 4.00 era so I think it was a case of just bad luck, and I remember the A’s really hammered them hard.
Loved this write-up. It made me feel like I was reading something from the old APBA Journal. Thanks for sharing this.
Pingback: 1901 APBA Replay Setup « Sport Replays & Sims
Scott, Nice job running both leagues; Nixie Callahan is a stud! Was wondering if someone in APBA world had accumulated enough data from replayers to determine what season sets actually played truest to real life right out of the box.
Hi Joe,
The card is unbelieveable and really needs to be on Monster Monday.
Final numbers for Nixey for me were:
.313 Avg. 3 2B 1 3B 1 HR 15 RBI and 17 SB
32-12 5 shutouts 3.10 ERA 0.96 WHIP.
During my World Series the Sox lost all their thirdbasemen and I was ready to put him in for games 6-7, but the series never got to that point.
You need to take part in a contest for one of the finest blogs on the net.
I will highly recommend this website!
Is Noodles Hahn graded an A in this set ? Great job by the way
Hahn is a B (Y)(Z)
There was a site I found once upon a time that tried to “correct” some errors in older printer APBA sets. Hahn was a B in that one as well, but he got an (X) instead of a (Y).
His K rate (K/BF) was about 55% higher than the 1901 NL average, so that (X) seems well warranted to me.
See my post above for why you won’t get accurate BB and K totals if you play the set as printed.
As Beignet posted on August 2nd (“I’m a very strong believer in rating hitters and fielders “literally” and pitchers by relative performance to the league.”), I don’t think APBA did it that way in these older sets. Which is why you’ll get season sets where, for example, there is only ONE pitcher rated an A. Pitcher grades *modify* batter cards, so there should always be a fairly consistent % of A pitchers in every set, no matter what season they’re for.
Chris, thanks so much for taking the time to respond, I appreciate it. Ed Zack said that Addie Joss in 1906 had a 1.73 era and threw over 280 innings and is graded a B. I couldn’t believe it. Thanks again.
Ha! Well I can tell you that I just bought the 1906 season this summer and they clearly went with newer formulas. You’ll be pleased to know that Joss is now an A.
Thanks again, Chris. DO you plan on replaying any of the dead ball era seasons ?
Frank – Definitely! :-)
I actually busted out the 1906 cards I got this summer and really dove into them trying to figure out how APBA was assigning W, X, Y, Z, or ZZ. Also the pitcher grades.
Well… did a ton of number crunching.
Basically got to the point where I could plug stats in to a formula, predict what their grade and letters should be and then find their card and see if it matched.
I was batting about .990 on the W, X, Y, Z, and ZZ ratings.
And the pitcher grades? Well, when determining if they should get a B or better, I was again about .990. If I felt they should get a C or D, I was batting about .900 instead.
All in all, pretty good.
I have a web page that can be used to easily see the ratings that I’m calculating and might share that with Thomas if he’s up for looking it over and/or posting it.
Might be a fun tool for folks who want to replay sets that were last calculated and printed by APBA back when they graded pitchers based primarily on their win totals and not so much other things.
In the interest of transparency, I was finding that the new grades were a mix of ERA, H/BF, and Wins, albeit with each of those 3 categories weighted somewhat differently…
Exciting stuff!
I’d even be willing to post all my 1901 ratings here just for a “sneak peak”. Again, not going to do any of this unless Thomas is curious.
BTW, I don’t have ANYBODY with an (R) in my calculations. And the reason being is just that the 1906 set I had didn’t have a single pitcher carded as an (R) so I’m not really 100% confident on what APBA’s criteria is for who should get an (R). There was another thread on this blog that suggested a certain data point at which it kicks in based on (BB-IBB)/BF relative to the league average. But I’d kinda’ like to see it in action with a set of cards in my hands first. Maybe when I pick up that 1902 set I’ll see some in there. :-)
Chris, i would love to your 1901 ratings, thanks again for the feedback.
Do you know if Bill Bradley is rated a 5 at 3rd ? Also, I assume Wallace is a 9 at SS. Merry Christmas, Chris ? Thanks again
Hi Frank,
Bradley is a 5 and Wallace is a 9
Thanks Chris, I really enjoyed reviewing it.
I have to assume you didn’t use the optional scoring rule. You made it a point to say 5 teams had 200 or more errors. In the real 1901 season, all 16 teams had 200 or more errors. In fact, the best team had 262!
I gave up on my replay of this season but really want to see APBA re grade. Giving high grades to pitchers based on their wins just leads to the best teams being even better than they should be – evidenced by the Pirates and White Sox both playing well above their real numbers.
Curious to see what kind of results you are getting for more recently released deadball seasons.
This is awesome! I just started the replay and am about 20 games in! Thanks for the write up!