


Reader Don George, who is a fan of one-team season replays, has completed the 1979 Cincinatti Reds replay. Don says it took 58 days to finish and once he did, he sent me a synopsis.
First, here is a quick recap in Don’s words:
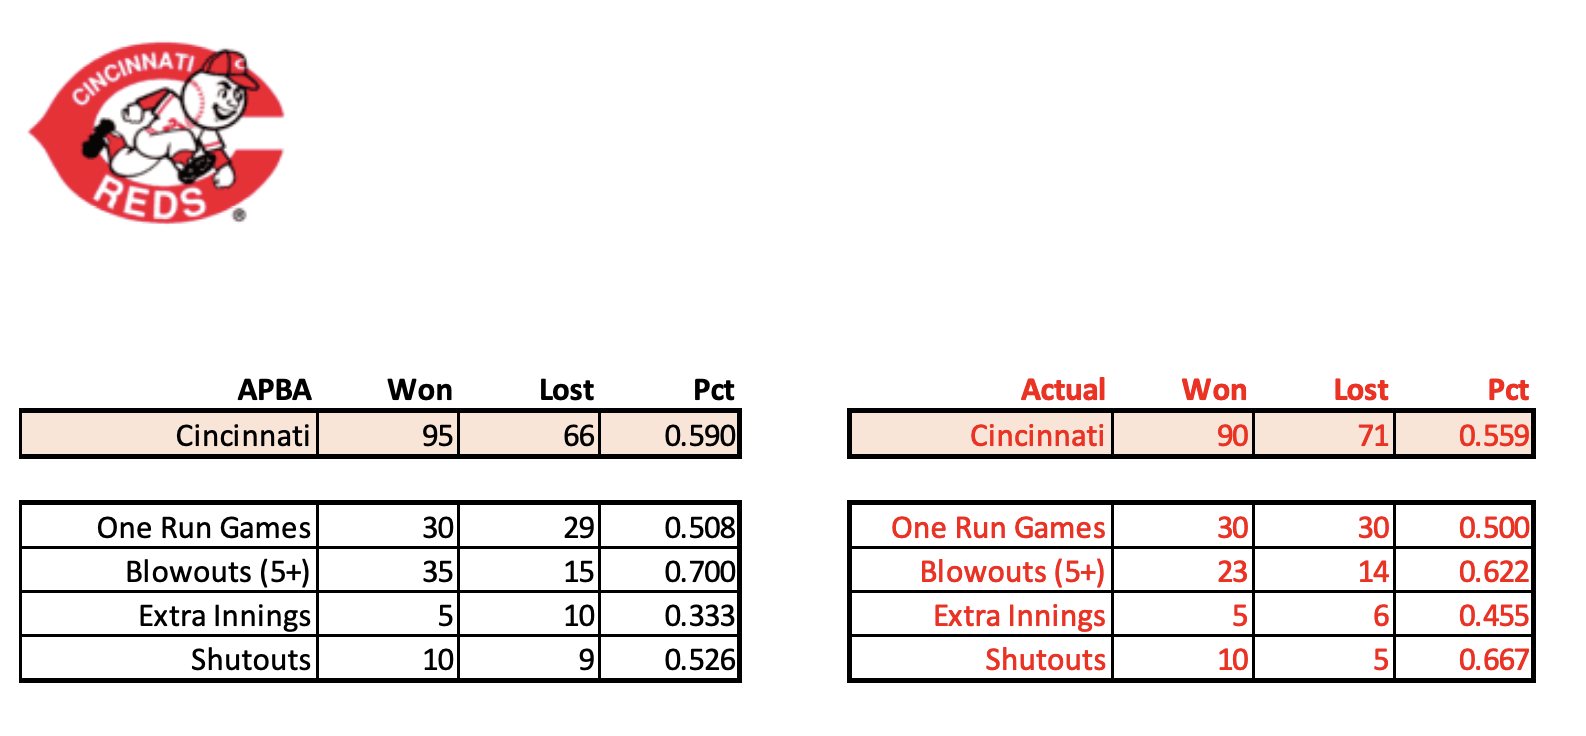
The 1979 Cincinnati Reds slightly outperformed their actuals during a recent season replay.
They played within one game of their actual head-to-head records versus 8 of their 11 opponents. Ken Griffey was a top overachiever in most offensive categories and George Foster did not disappoint in the HR department. Tom Hume fell short of his 17 actual saves, but managed to lodge an amazing 19-2 record!
Next up: 1979 Nolan Ryan, all games pitched
Cheers, Don, Cincinnati
Don’s Reds went 95-66 compared to the actual 90-71 in 1979 still retaining first place.
Overall, Don’s ’79 replay was pretty accurate. If we’re being totally honest about the baseball tabletop games out there, that is APBA’s forte. While you, as the manager, are limited on the actions you can take, you will get accurate stats. That’s what I like about it.
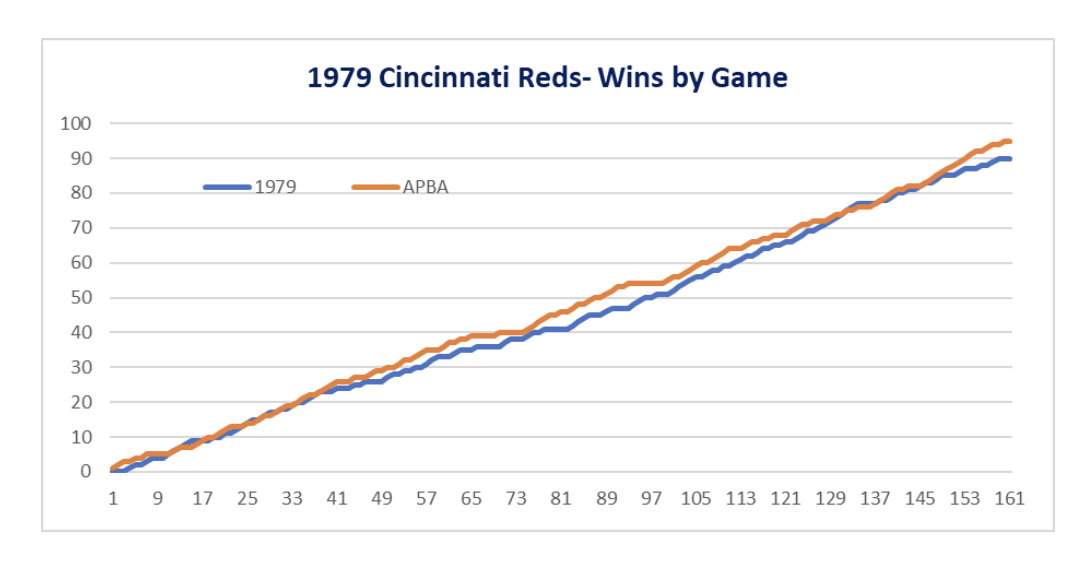
Look at Don’s chart of Wins by Game.
Don’s recap compares the W-L, hitting and pitching. Amazingly, the Cubs had one of the best face to face records (6-6) only eclipsed by Montreal who owned the Reds couldn’t solve at 3-9.
As you saw, Don promises a 1979 Nolan Ryan replay. That should be something.
Keep up the good stuff, Don!
The accuracy is outstanding. And, if one considers Research P-Value of .05%, Mr. George’s replay is certainly there (162 / 161 x .05 = 8G) if one considers just the 5 games to-the-good. If one says “well, its actually a 10 game swing – for every win, it is also 1 less loss” – then one must ALSO consider Mr. George manages differently than John MacNamara. This is a Participant Variable, whose impact is difficult to quantify, but can account for the .01% diff. (8G to 10G). Donald M. Davis, PhD – Lehigh University – produced an oft cited Markov Analysis using APBA Baseball noting its exceptional accuracy. if anyone is a nerd like me, it’s worth a read and freely available on the world-wide. Very well done, both Mr. George & APBA Blog.