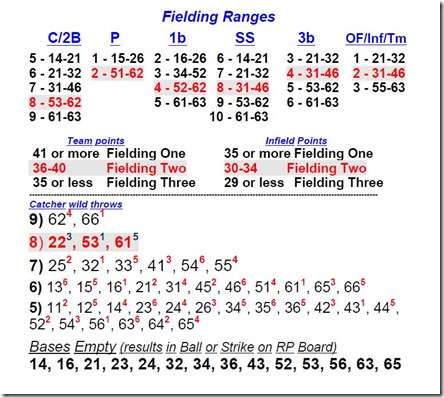
When I first started playing the APBA Master Game (baseball), I quickly found I was wearing out the board that contained the various fielding ranges. It was shopworn after three months and steadily went downhill after that.
In addition, I found I was practically going blind trying to find where Fielding One, Two and Three started and ended. I color-coded the board, but it was still hard to read.
After the new booklet form came out, the problem still remained. Only the numbers were smaller.
My solution? A chart that simply identifies only the Fielding Two numbers, by position, as well as some other easy-to-use fielding solutions. Here it is in pdf format.
The Fielding Range Chart identifies only those numbers that are in the Fielding Two range. Anything better is Fielding One. Anything worse is Fielding Three.
Take 1b-4, for example. If you roll anything between 52-62, it’s Fielding Two. Anything between 11-51 is Fielding One. Anything from 63-66 is Fielding Three.
But, all you have to deal with is the range of Fielding Two. It’s a simplified version of the complicated APBA Fielding Chart.
It requires a few games to get use to the Fielding Range Chart, but once you get the hang of it, games really move along and you don’t find yourself using a ruler to figure out where the various fielding breaks occur on the hard-to-read APBA chart.
Next: More on the Fielding Range Chart


Great idea and definitely going to use this!
‘Nice job! Could you explain how the errors on catchers throws portion of the chart works? Thanks again